Retail is shrinking in Philadelphia’s neighborhoods. The total number of storefront businesses isn’t. Here’s what’s growing instead, and what it means for the people who run those streets.
If you manage a neighborhood commercial corridor, most of the conversation you hear is about retail: the shop that closed, the pharmacy that left, the clothing store a corridor plan hopes to attract. The Census Bureau’s business counts tell a different story.
Between 2019 and 2023, Philadelphia’s neighborhoods outside Center City lost about 190 retail businesses, a drop of 5%. In the same four years they gained nearly 80 personal care businesses (salons, nail shops, tattoo studios and the like), an 11% rise, while restaurants held about steady.
The total held. The mix changed. And personal care grew fastest in the city’s lowest-income neighborhoods.
What’s opening, and what isn’t
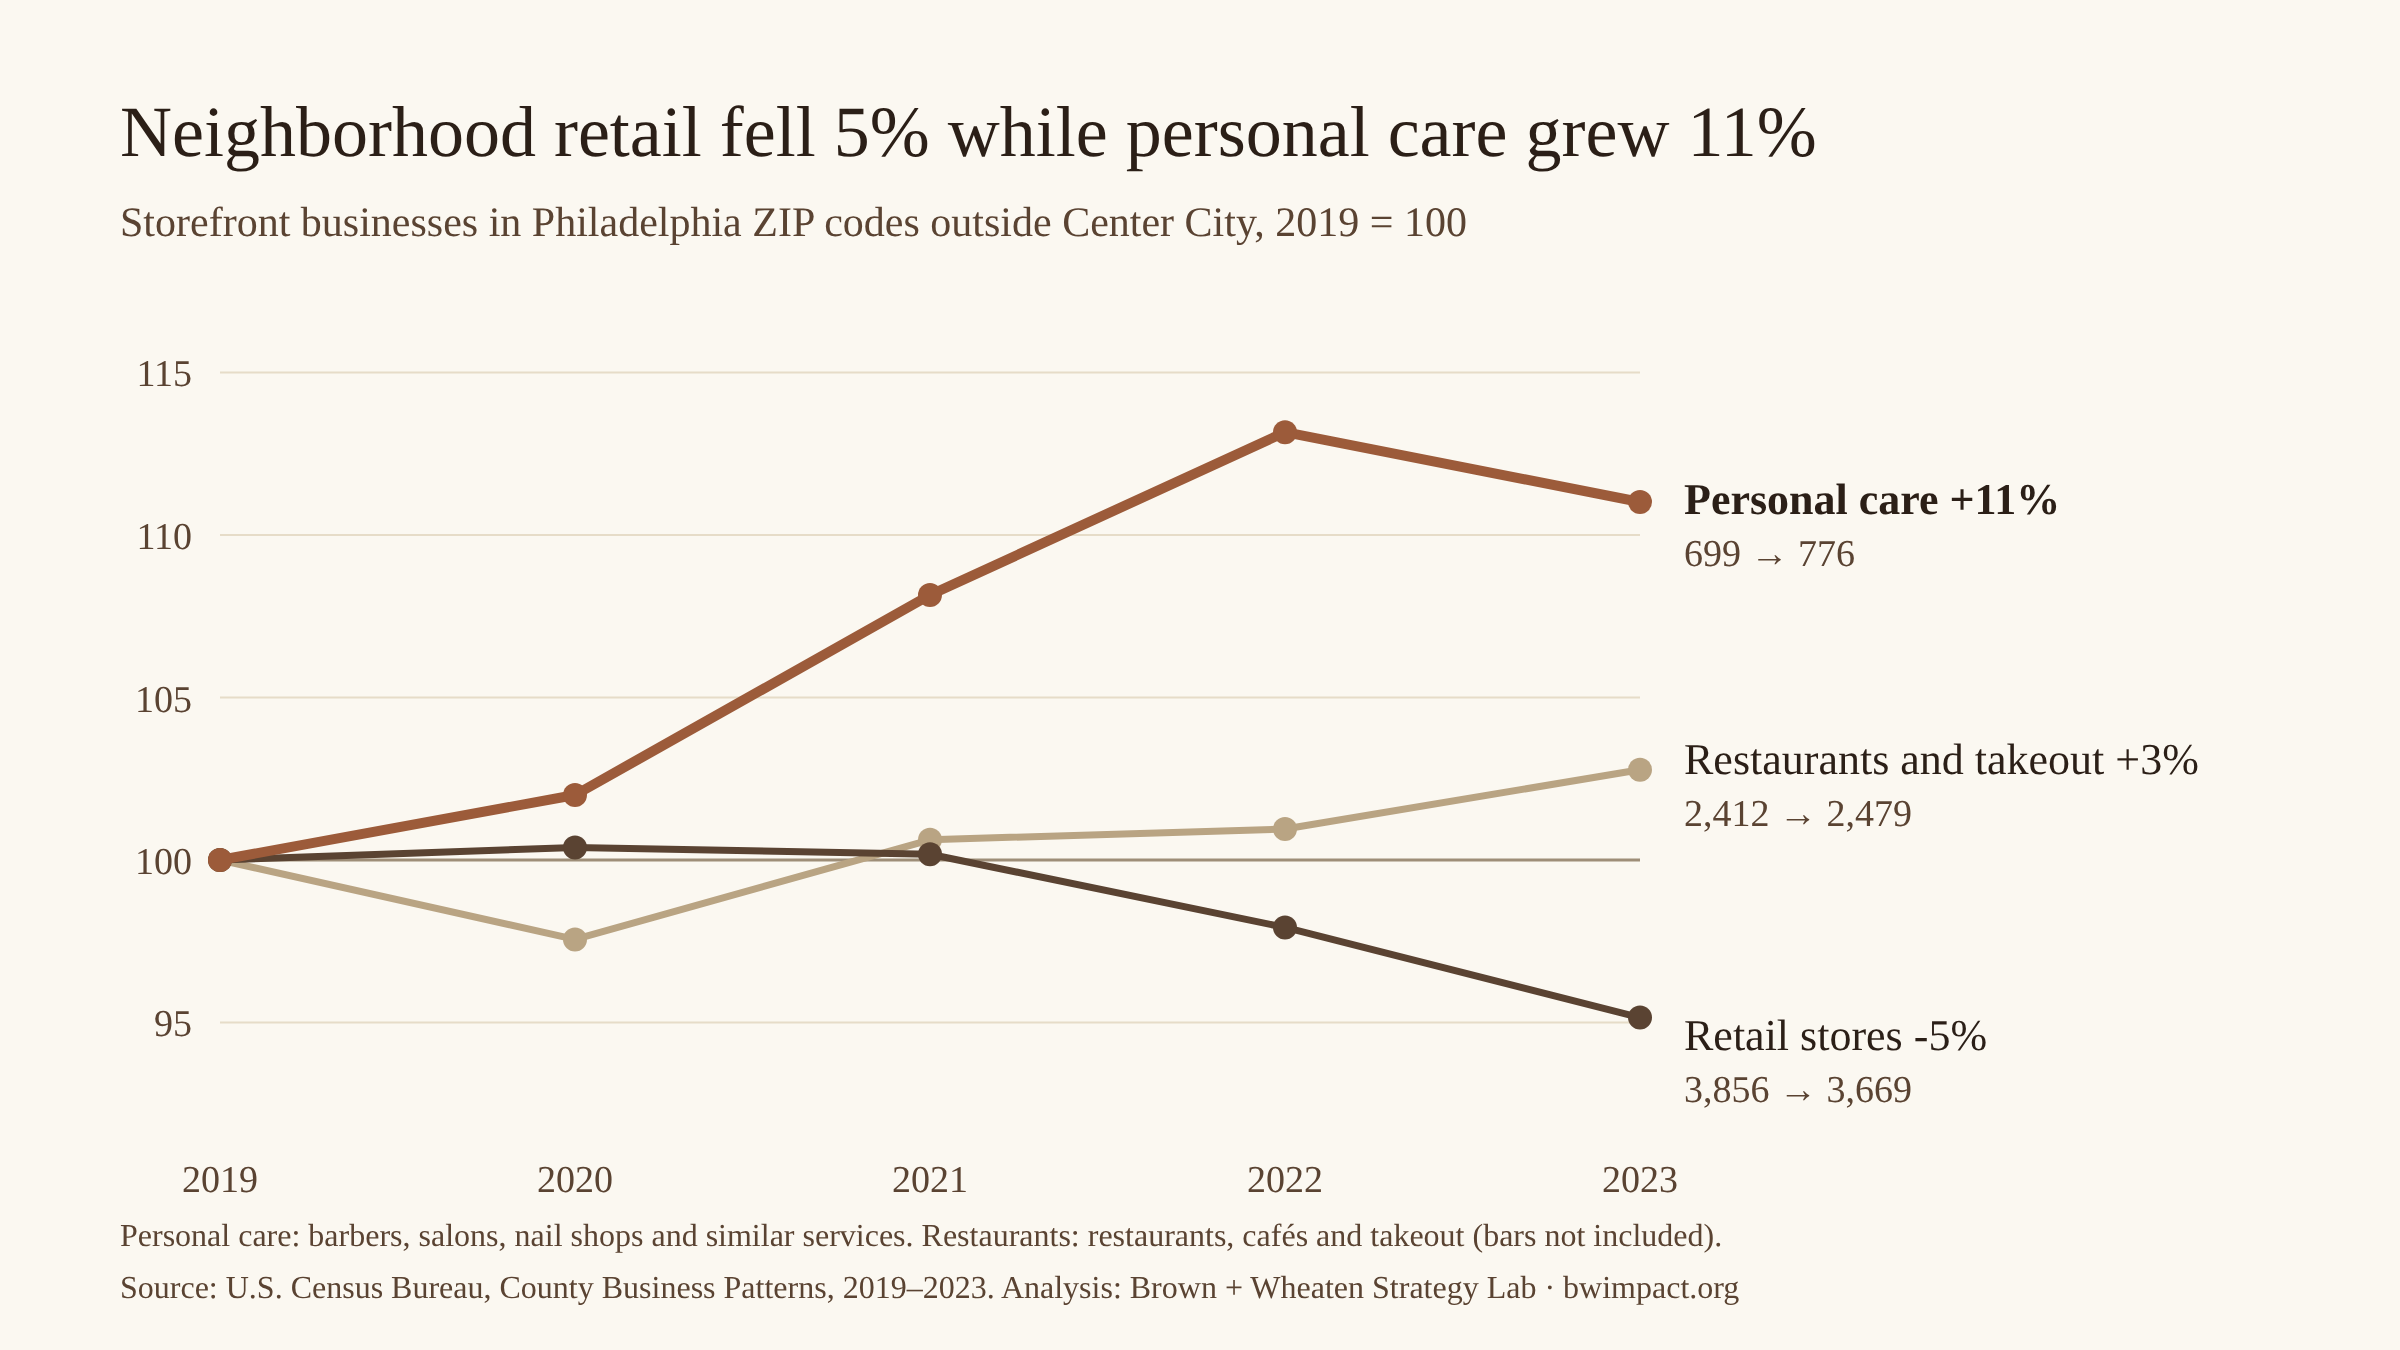
Retail held steady through the first year of the pandemic, then fell every year after. Restaurants dipped in 2020 and recovered to about where they started. The City’s own food licenses show them down about 6% over the same years, so we treat restaurants as roughly flat rather than growing. Personal care grew three years running, with a small dip in 2023.
More than a third of the retail drop is gas stations and car dealers. Set those aside, and the rest of retail, mostly the kind of shop that fills a storefront, fell about 3.5%.
Within personal care, the growth wasn’t where you might expect. Beauty salons held flat. Nail salons grew 14%, and a catch-all Census category that includes tattoo studios, tanning salons and hair-removal services nearly doubled.
One plausible explanation: a manicure or a tattoo can’t be shipped from a warehouse.
Personal care grew fastest where incomes are lowest. In the third of Philadelphia’s ZIP codes with the lowest household incomes, personal care businesses grew 14% while retail fell 3%. In the middle-income third, retail fell 7% and personal care grew about 6%.
That matters because these businesses aren’t interchangeable. A salon or a takeout counter often keeps different hours, can draw a different crowd and needs different things from its landlord and its street than a shop does. It may also change the rhythm of the street. A shop tends to draw browsers who wander; a salon tends to draw people on a schedule, who may stay for dinner or may head straight home. If your corridor’s anchors are now appointments rather than shops, it’s worth knowing when people are actually there, and which neighbors benefit.
Downtown fell further
Center City’s four core ZIP codes lost about one in ten of their storefront businesses over the same years, from 1,594 to 1,438.* Retail, restaurants and personal care all fell. A wider Center City that takes in Northern Liberties, Fairmount, Graduate Hospital and Queen Village still lost about 6%.
The neighborhoods, by contrast, ended 2023 within 1% of where they started. The growth in personal care, in particular, is mostly a neighborhood story: in the four core downtown ZIP codes, their count slipped from 194 to 188.
Your ZIP code is not your corridor
Everything above is measured by ZIP code, because that is the smallest area the Census Bureau publishes business counts for. That’s fine for a citywide pattern. It’s a problem when a district uses the same figures to describe its own street, and grant applications sometimes do.
This fall we measured nine Philadelphia commercial corridors address by address. Two of them, which we won’t name, show the problem:
Growth that belonged to the neighbors. One corridor’s two ZIP codes added 76 business locations between 2019 and 2023, well ahead of the city. But 60 of them were in the ZIP code that mostly covers the neighborhood next door.
A decline that missed the corridor. Another corridor’s ZIP codes lost 6% of their businesses over the same years. Yet regular SBA lending at the corridor’s own addresses picked up: 9 loans since fiscal 2020, against 6 in the ten years before. That’s a small count, but more than double the yearly pace.
In the first case, the ZIP codes credit the corridor with growth that mostly happened next door. In the second, the ZIP codes’ decline says nothing about the lending picking up on the corridor itself.
Across all nine, the corridor was a small part of its ZIP codes. Of all the businesses in those ZIP codes that took federal relief loans in 2020–21, the ones at the corridor’s own addresses made up between 2% and 18%. A ZIP code’s figure usually describes a much bigger place than the street.
What this means for your corridor
Recruit for what’s actually opening. If the growth in neighborhood storefronts is nail salons and newer personal services, with restaurants holding their ground, a recruitment plan built around retail is fishing in a shrinking pond. These businesses need different things from a corridor: plumbing for wash stations, venting for kitchens, evening and weekend foot traffic, help with state and City licensing. A district that knows that can help them faster than one still waiting for a shoe store.
Measure the street, not the ZIP code. Before a figure goes into a grant application or a renewal plan, ask whether it describes your corridor or the area around it. If the corridor’s own story is stronger than the ZIP code’s, you’re underselling it. If it’s weaker, someone reviewing the application may notice.
The pattern here is citywide. Whether your corridor follows it, or is one of the exceptions, takes measuring the corridor itself. If you’d like to see what that looks like, here’s a sample Corridor Read.
How we measured it
*These counts run through 2023, the latest year the Census Bureau has published. Center City’s storefronts have held steady since then, at about 84% occupied, and the Center City District’s own reports track them closely. We haven’t found a published comparison for the other side of the ledger: the neighborhoods that held.
Business counts: U.S. Census Bureau, County Business Patterns by ZIP code, 2019 through 2023, the latest year published. These count businesses with at least one employee; owner-only businesses aren’t included, which likely understates the neighborhood side.
Storefront businesses: retail (industry codes 44–45; the 3.5% figure excludes gas stations, 447, and car dealers, 441); restaurants, cafés and takeout (7225; bars, coded separately, are not included); and personal care services such as barbers, salons and nail shops (8121). The same industry codes are used in every year.
Cross-check: City of Philadelphia Food Preparing and Serving licenses, active locations at each year-end, 2019–2023. They point down about 6% where the Census counts point up about 3%, so the article treats restaurants as roughly flat. The State licenses barbershops and salons but doesn’t publish those records in bulk, so personal care rests on the Census counts alone.
Center City: ZIP codes 19102, 19103, 19106 and 19107. The wider test adds 19123, 19130, 19146 and 19147. Neighborhoods are every other Philadelphia ZIP code.
Income thirds: Philadelphia ZIP codes ranked by median household income (American Community Survey 2020–24) and split into three equal groups.
SBA lending: for the second corridor example, SBA 7(a) and 504 loan approvals at the corridor’s own addresses, fiscal 2010–19 compared with fiscal 2020 through June 2026; cancelled and unfunded loans excluded.
Corridor shares: relief-loan borrowers at each corridor’s own addresses, compared with all borrowers in its ZIP codes, from SBA Paycheck Protection Program data, 2020–21. Those borrowers include many self-employed people working from home; among other borrowers, the corridor’s share was usually a fifth or less.
Analysis by Brown + Wheaten Strategy Lab